Ohjeita palvelun käyttöön, ole hyvä!
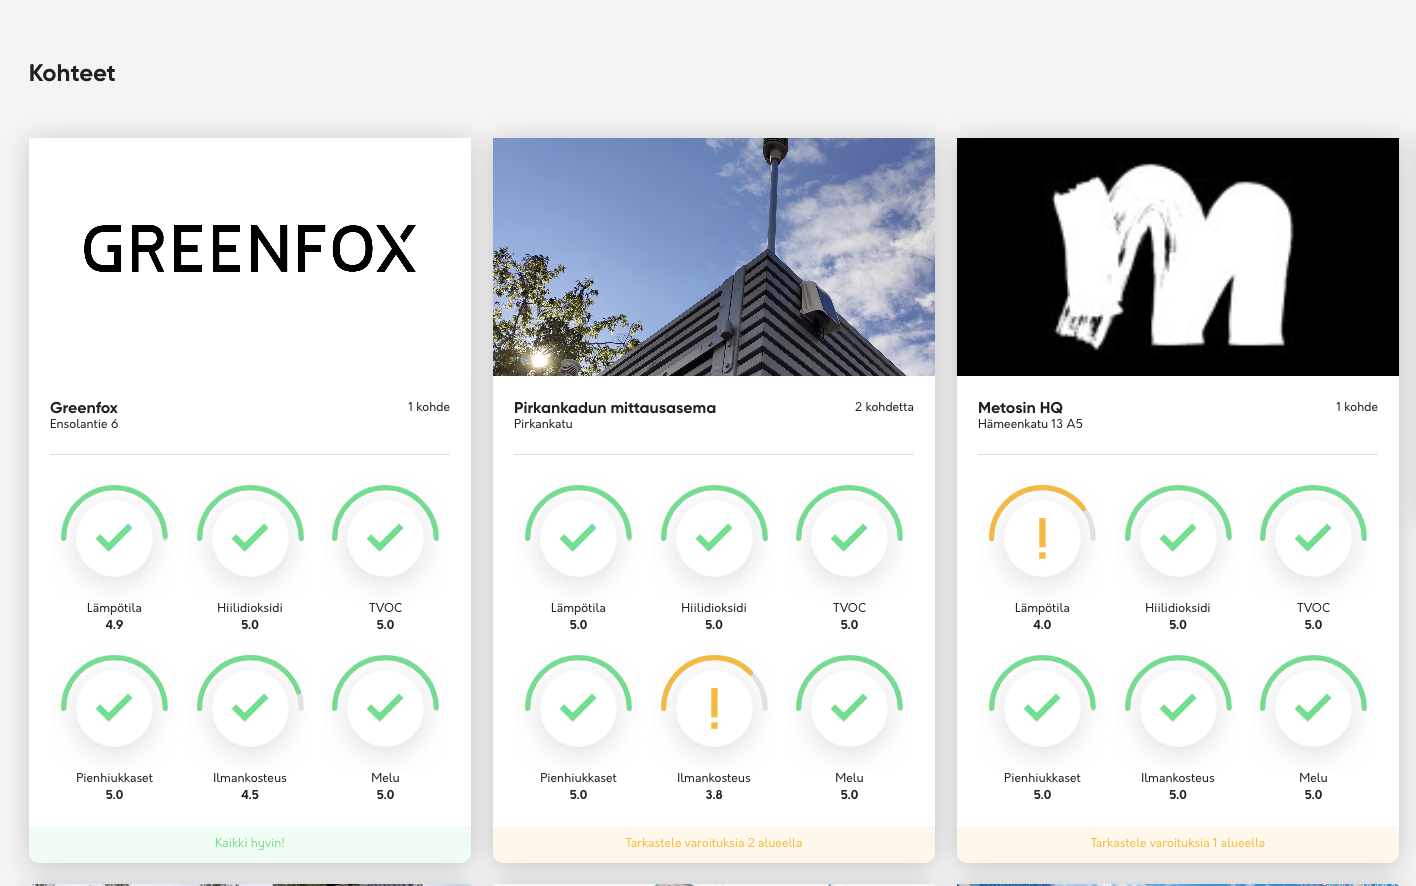
Kirjaudu palveluun erillisen ohjeen mukaan syöttämällä käyttäjätunnuksen ja salananasi jotta näet yksilöllisen näkymäsi.
Ilmanlaatupalvelu on kolmitasoinen.
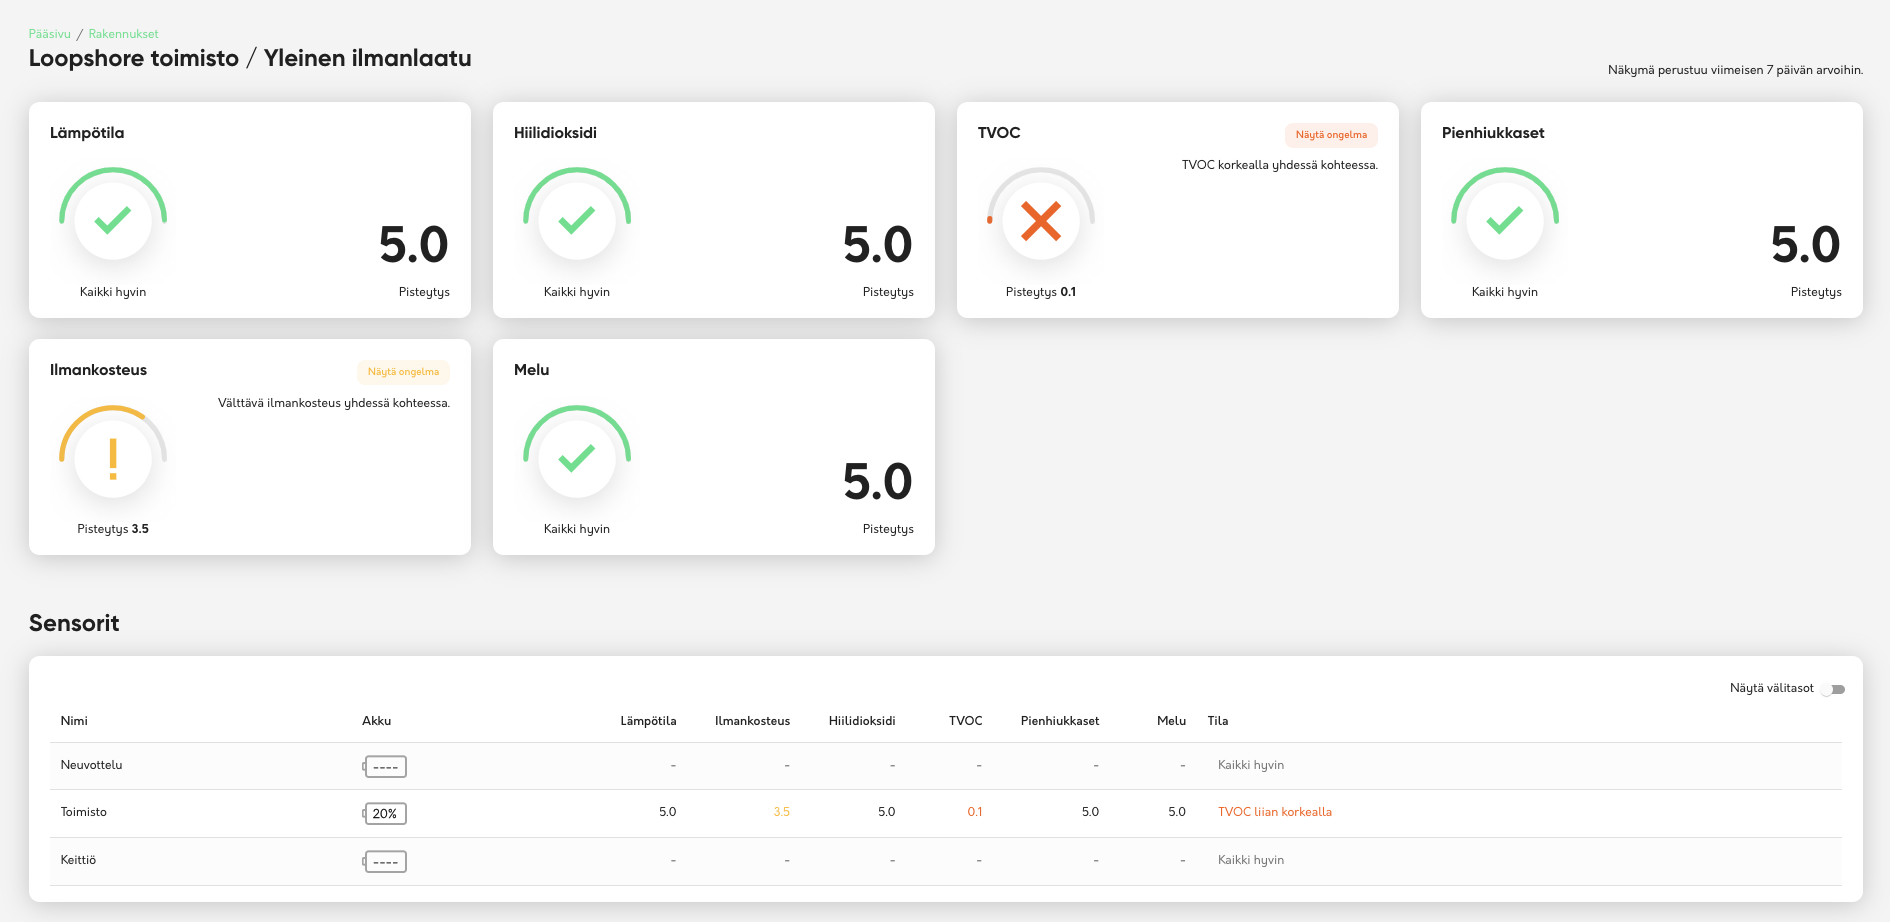
Pääsivun ”Kohteet” kuvaa klikkaamalla siirryt “yleinen ilmanlaatu” -koontisivulle.
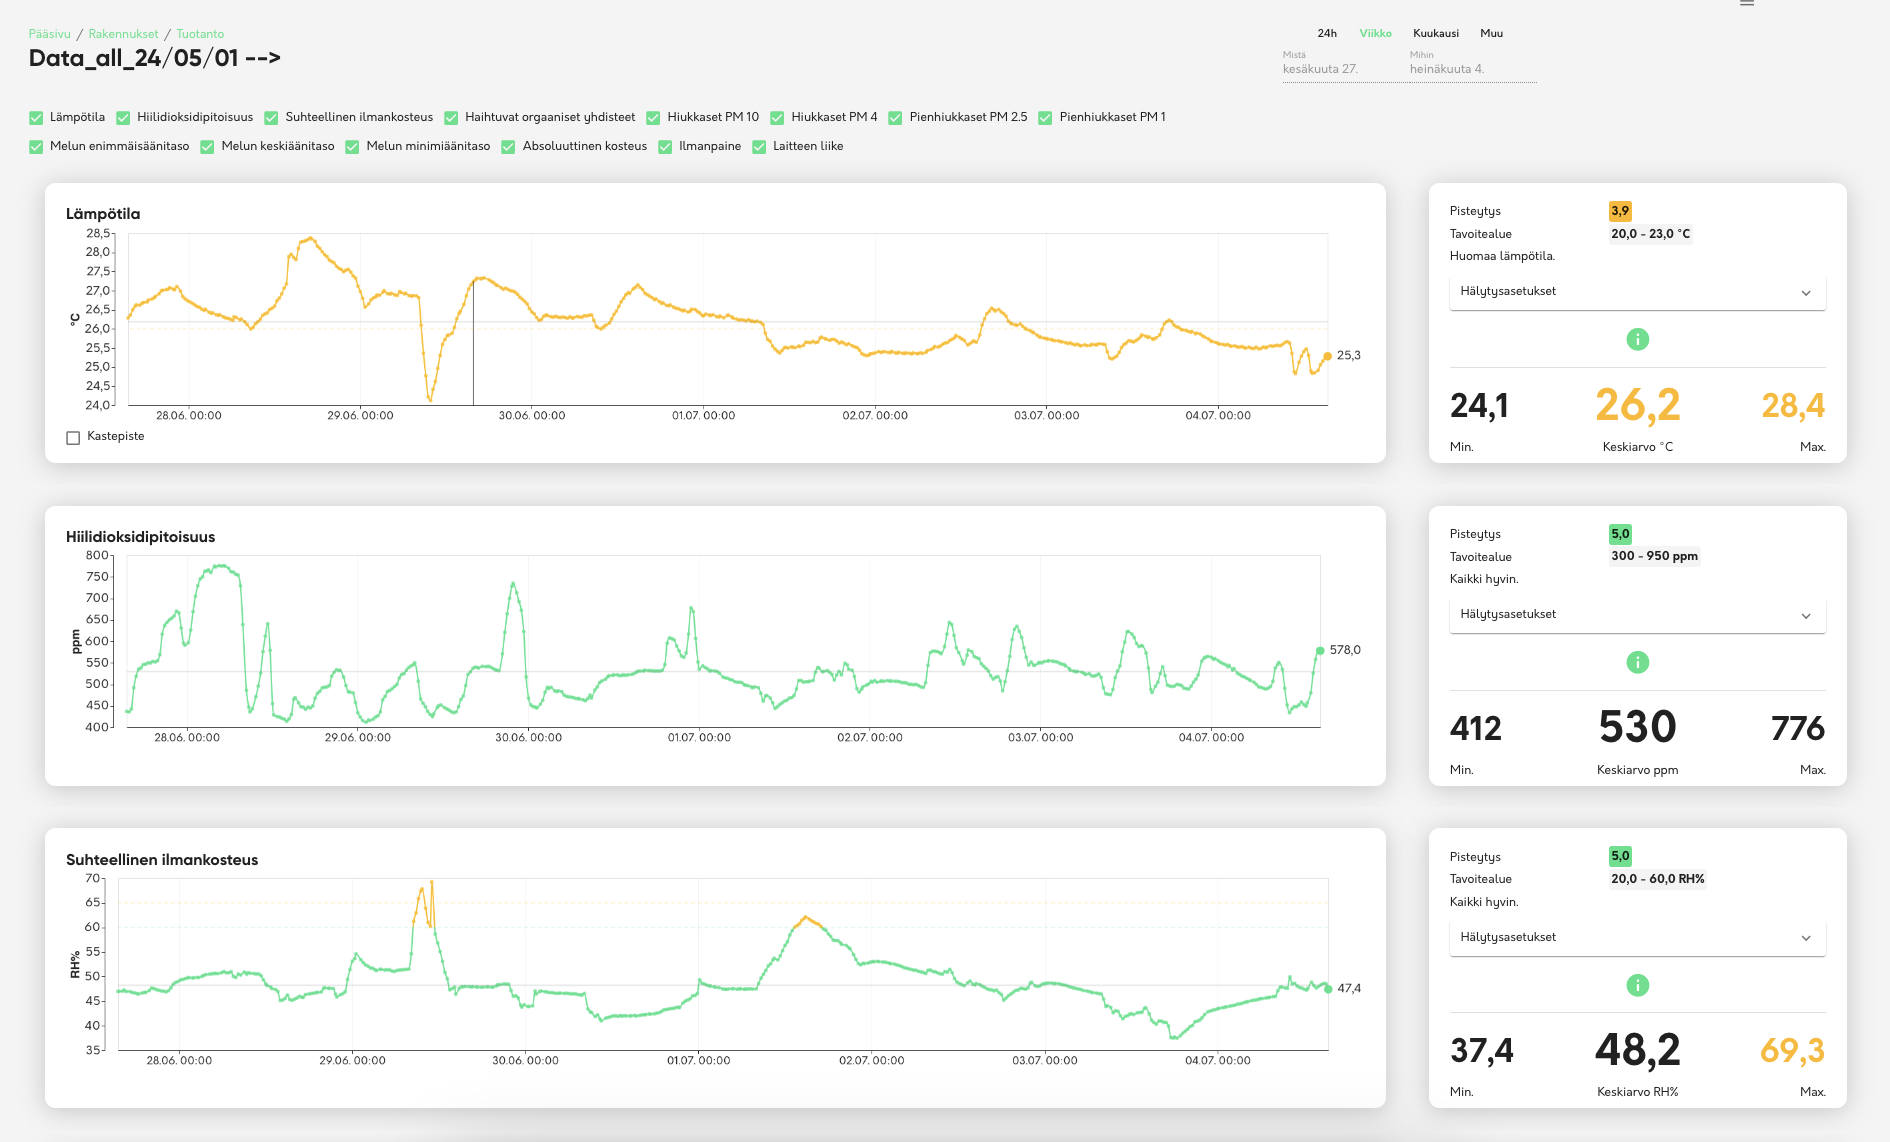
Sen alaosasta sensorin nimeä klikkaamalla pääset katsomaan yksittäisen sensorin dataa graafisena esityksenä.
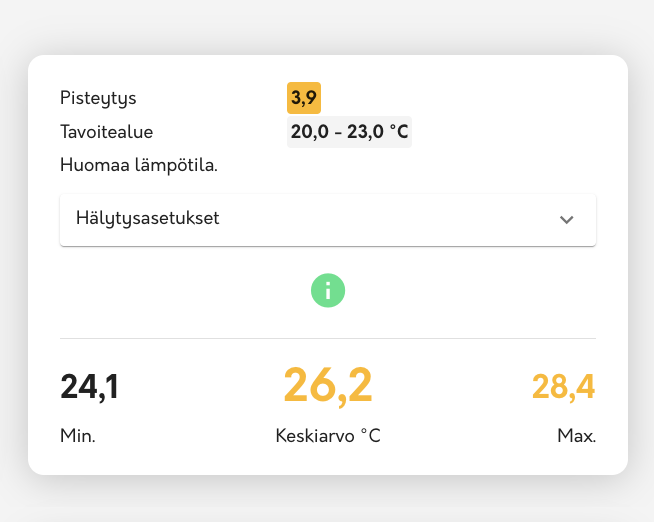
Jokaisen graafin oikeassa reunassa on vihreä info-nappula. Sieltä voit lukea lisätietoja kustakin mittauksesta.
Liikennevalovärit graafeissa (vihreä, keltainen, punainen) kuvaavat tilannette ja niitä voit hyödyntää vaikka et olisikaan ilmanlaadun asiantuntija.
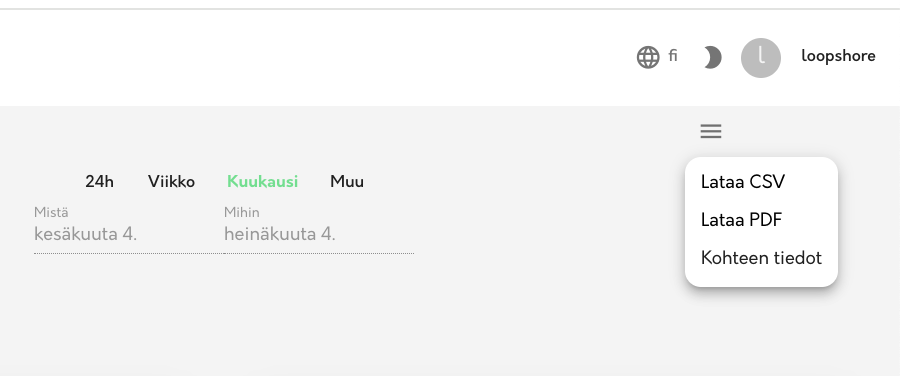
Sensorin / tilan nimen voit muuttaa itse kohdasta “kohteen tiedot”. Kun esimerkiksi siirrät sensorin toiseen tilaan ja muutat nimen, tallentuu graafiin merkintä nimenmuutoksesta. Näin voit helposti myöhemmin todentaa, milloin sensori on vaihtanut paikkaa ja etsiä datan juuri tältä aikavälilltä.
Oikeasta yläkulmasta lataat tarvittaessa raakadatan CSV-tiedostona. Huomaa UTC-aika.
Näytölle haetuista kuvaajista voit muodostaa PDF-tiedoston.
“Hälytysasetukset” avaa valikon jossa muutat halutessasi raja-arvot tilanteeseenne sopiviksi. Voit käyttää palvelua myös sinne asetetuilla oletusraja-arvoilla.
Sähköpostihälytys lähtee järjestelmäämme tallennettuun osoitteeseen. Tekstiviestihälytys itse palvelussa määrittämääsi puhelinnumeroon. Viipeen määrittäminen on kätevä esim. silloin jos lämpötila sahaa.
Tekemäsi muutokset ovat aina laitekohtaisia. Huomaa että jos teillä on useampi käyttäjätunnus yhdelle sensorille, jokainen käyttäjä muokkaa samoja raja-arvoja.
Sähköpostihälytykset ovat oletuksena pois päältä.
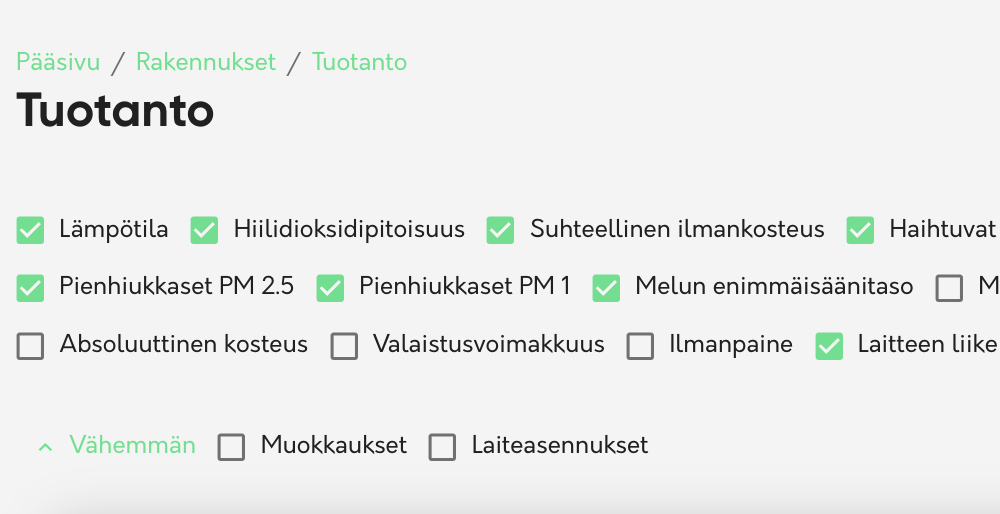
Suuretietojan alapuolelta avaat valikon ”muokkaukset / laiteasennus” . Kun muokkaukset -täppä on valittuna, näet graafista laitteen nimenmuutosten ajankohdat. Tämä tieto on hyödyllinen esimerkiksi silloin kun sama laite kiertää useammassa eri tilassa. Laiteasennus kertoo hetken jolloin laite on tuotu järjestelmään tai vaihdettu uuteen. Tyypillisimmin se näkyy vain aivan datan alussa. Mikäli muutoksia ei ole, koko valikko näkyy harmaana.
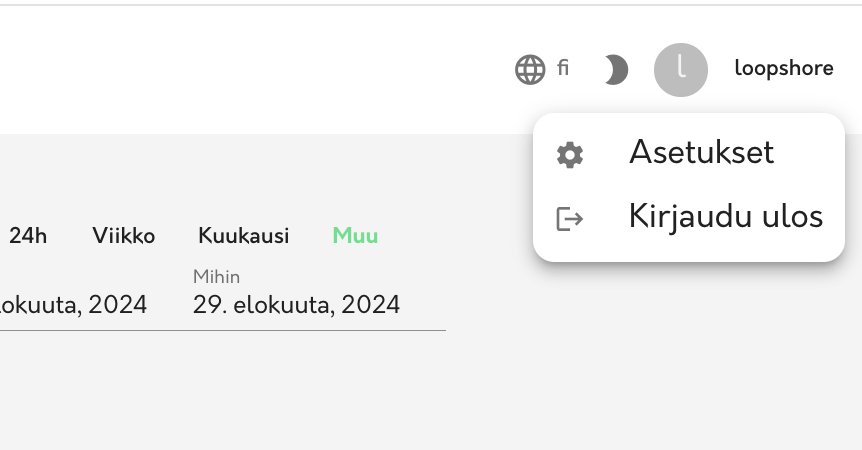
Katso myös kohta ”Asetukset”. Suosittelemme, että otat erikseen käyttöön laitteen akun loppumisesta ilmoittavan hälytyksen.
Please find below instructions on how to use the service
Log in to the service by entering your username and password according to the separate instructions to view your personalized view.
The air quality service is three-tiered.
By clicking on ”Locations” on the main page, you will navigate to the ”Overall air health” summary page. By clicking on the sensor name at the bottom, you can view the data of a single sensor as a graphical representation.
There is a green info button on the right side of each graph. From there, you can read more about each measurement. The traffic light colors in the graphs (green, yellow, red) describe the situation and can be used even if you are
not an air quality expert.
You can change the sensor/location name yourself under ”location information”. For example, when you move the sensor to another room and change the name, a note of the name change is saved in the graph. This allows you to easily verify
later when the sensor has changed location and find data from that specific time period.
In the upper right corner, you can download the raw data as a CSV file if needed. Please note the UTC time. You can create a PDF file from the graphs displayed on the screen.
”Alarm settings” opens a menu where you can change the limit values to suit your situation if desired. You can also use the service with the default limit values set there. An email alert is sent to the address stored in our system.
A text message alert is sent to the phone number you specify in the service itself. Setting a hysteresis is handy, for example, if the temperature fluctuates. The changes you make are always device-specific. Please note that if you
have multiple usernames for one sensor, each user modifies the same limit values.
Email alerts are turned off by default.
Below the main data, you open the menu ”modifications / installations”. When the box is checked, you can see the graphical time of the device name changes. This information is useful, for example, when the same device circulates in several different rooms. Device installation tells the moment when the device was added to the system or replaced with a new one. Typically, it only appears at the very beginning of the data. If there are no changes, the entire menu appears gray.
See also the ”Settings” section. We recommend that you enable the alert for the device’s battery running out separately.


